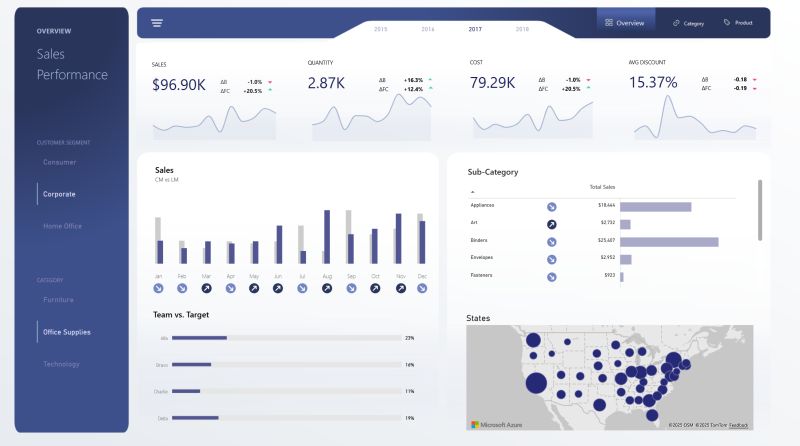
We keep meeting teams who have beautiful dashboards – but still make decisions in WhatsApp chats and Excel. The problem is rarely “no data”. It’s that the dashboards are not designed for how decisions are actually made.
Pattern we see in almost every broken dashboard
When we get called in to “fix” a dashboard, we usually see the same patterns:
- Too many charts, not enough clear questions.
- No single view for “Is this good or bad this week?”
- KPIs mixed for different teams in the same page.
- Looks great in a screenshot, confusing in a review meeting.

Step 1: Design around a real decision, not a data source
Before opening Power BI, we ask a simple question:
“What decision do you take weekly or monthly that this dashboard should support?”
For example:
- Which campaigns to scale, pause or test next.
- Which customer segments need a retention push.
- Which zones or SKUs need focus from sales teams.
Once that is clear, the dashboard layout becomes much easier: top part for “Are we winning or losing?”, middle for “Why?”, and bottom for “What should we try next?”.

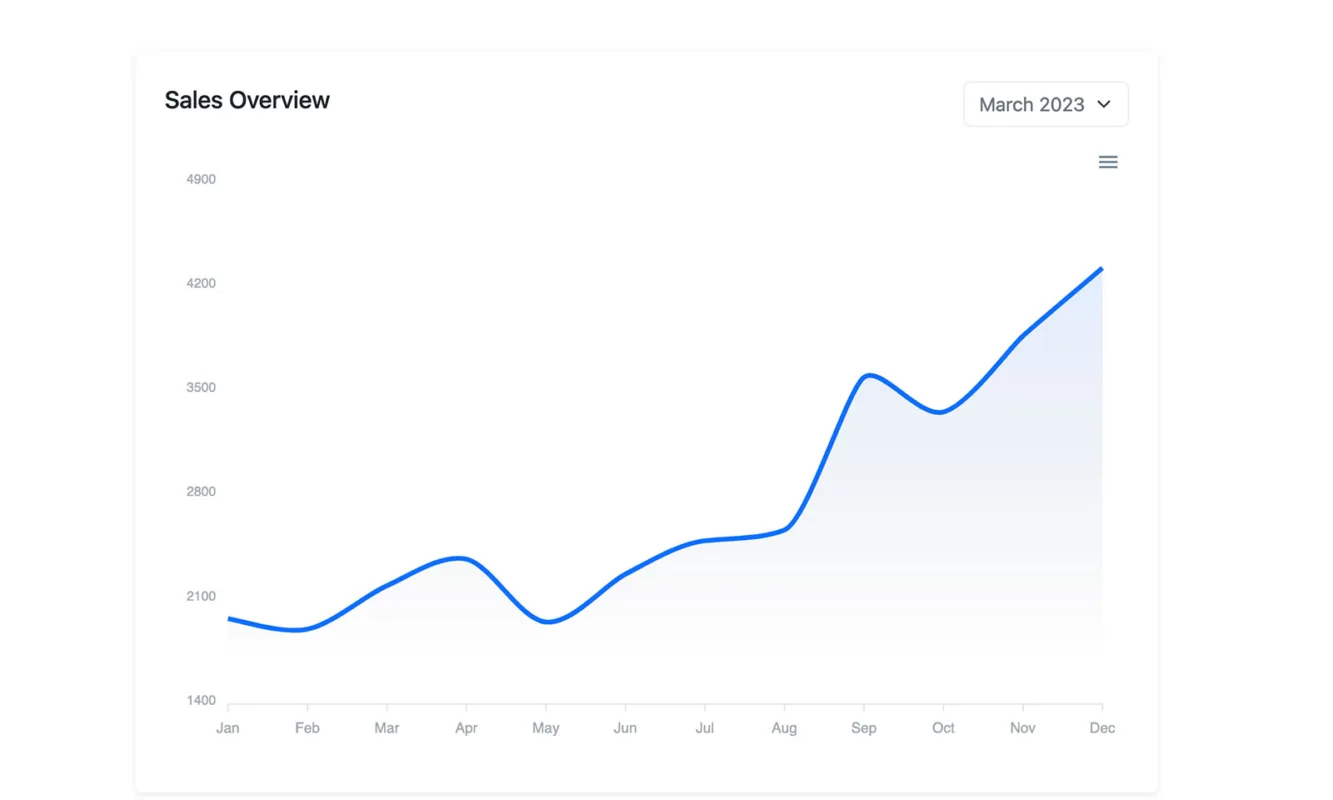
Step 2: Show fewer numbers, but with more context
Dashboards often fail because they show more data, less meaning. For each key metric, try to always show:
- Current value (this week / month)
- Comparison (vs target / last period)
- Direction (arrow or color for movement)

Step 3: Match views to roles
A single “master dashboard” for everyone sounds good, but usually ends up serving no one perfectly.
For most clients, we end up creating at least:
- Leadership view: few KPIs, trend and exceptions.
- Manager view: breakdowns by team / region / segment.
- Analyst view: more filters, drill-down and export options.
The goal is not “one big dashboard”. The goal is “the right view at the right level”.
Want your dashboards to finally drive decisions?
We work with teams to redesign their existing dashboards around real decision rituals – weekly, monthly and quarterly.
Talk about a dashboard redesign