Unified Customer View
One row per customer.
We stitched order, campaign and CRM data into a single customer-level table, making CLV, recency and frequency easy to calculate and track over time.
Case Study · Retail | CLV & Retention
How a retail brand used CLV & retention analytics to grow repeat orders sustainably instead of burning money on offers.

A mid-sized retail brand was acquiring new customers at a healthy pace, but repeat orders were stagnating. Despite frequent discounts and campaigns, long-term value per customer was flat.
Leadership knew retention mattered, but they lacked a clear view of who was coming back, when, and why.
One row per customer.
We stitched order, campaign and CRM data into a single customer-level table, making CLV, recency and frequency easy to calculate and track over time.
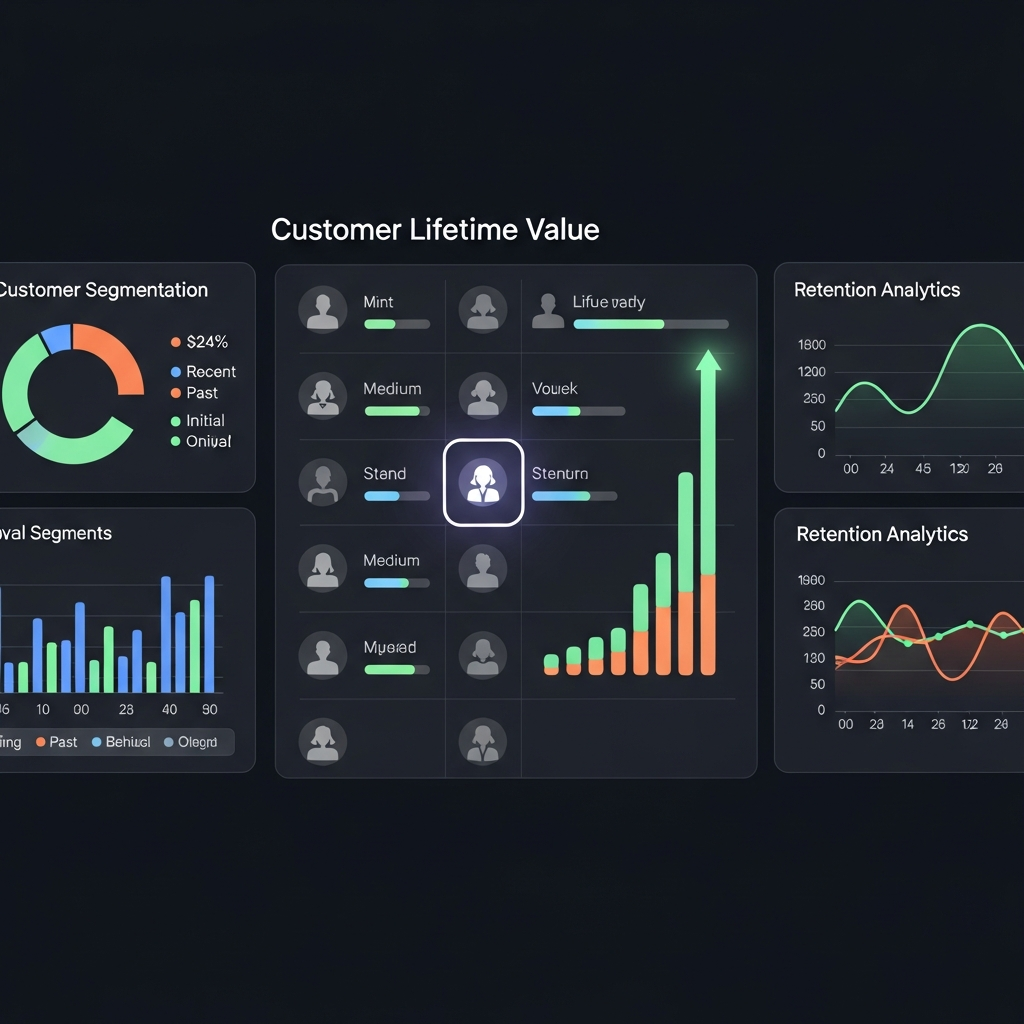
Who comes back, and when?
Cohort dashboards showed first-time buyers vs. repeat customers, time between orders, and how CLV evolved by acquisition channel and campaign.
Right offer, right group.
We defined segments (new, promising, at-risk, lapsing) and aligned distinct campaign strategies and KPIs for each group.
Targeted campaigns and better timing increased second and third orders without increasing overall discount budget.
The brand saw which channels attracted customers who stayed and spent more, not just who converted first.
Retention and CLV were added to monthly and quarterly review dashboards, shifting focus beyond “this month’s revenue”.
Share your current reports and data sources. We’ll outline a retention and CLV view tailored to your brand.